Healthy Indoor environment for human and animals
A healthy indoor climate is important for the health of animals. In order to analyze the indoor climate, the climate limit value per animal group has been examined. The specific limit values per animal species can be found in the table below.
The red numbers are the limits for this animal category.
The black numbers are the lower and top numbers for the Y axis.
| Animal type |
Ammonia (ppm) |
Carbon dioxide (ppm) |
Hydrogen sulfide (ppm) |
Healthy Climate Index () |
Humidity (%) |
Light (%) |
Methane (ppm) |
Oxygen (%) |
Sound pressure (dB) |
Temperature (°C) |
Heat stress index (°C) |
|---|---|---|---|---|---|---|---|---|---|---|---|
Calves |
7 0 |
5000 1200 400 0 |
100 1 0 |
10 8 5 1 |
100 80 40 0 |
25 0 |
5000 1000 0 |
25 23.5 19 0 |
80 50 40 35 |
25 15 |
104 76 68 20 |
Cattle |
7 0 |
5000 1200 400 0 |
100 0 |
10 8 5 1 |
100 80 40 0 |
25 0 |
5000 1000 0 |
25 23.5 19 0 |
80 50 40 35 |
25 |
104 76 68 20 |
Dairy cattle |
7 0 |
5000 1200 400 0 |
100 0 |
10 8 5 1 |
100 80 40 0 |
25 0 |
5000 1000 0 |
25 23.5 19 0 |
80 50 40 35 |
25 |
104 76 68 20 |
Goat |
15 0 |
5000 3000 400 0 |
100 0 |
10 8 5 1 |
100 80 40 0 |
25 0 |
5000 1000 0 |
25 23.5 19 0 |
80 50 40 35 |
27 5 0 |
|
Horse |
4 0 |
5000 2500 400 0 |
100 1 0 |
10 8 5 1 |
100 80 40 0 |
25 0 |
5000 1000 0 |
25 23.5 19 0 |
80 50 40 35 |
25 -5 |
|
Pig |
20 0 |
5000 3000 400 0 |
100 10 0 |
10 8 5 1 |
100 80 40 0 |
25 0 |
5000 1000 0 |
25 23.5 19 0 |
80 50 40 35 |
26 13 0 |
104 75 75 54 |
Sow |
20 0 |
5000 3000 400 0 |
100 10 0 |
10 8 5 1 |
100 80 40 0 |
25 0 |
5000 1000 0 |
25 23.5 19 0 |
80 50 40 35 |
26 13 0 |
104 75 75 54 |
Piglets |
20 0 |
5000 3000 400 0 |
100 10 0 |
10 8 5 1 |
100 80 50 0 |
25 0 |
5000 1000 0 |
25 23.5 19 0 |
80 50 40 35 |
28 16 0 |
104 79 75 54 |
Sheep |
7 0 |
5000 1200 400 0 |
100 0 |
10 8 5 1 |
100 80 40 0 |
25 0 |
5000 1000 0 |
25 23.5 19 0 |
80 50 40 35 |
25 0 -10 |
|
Human |
7 0 |
5000 1200 400 0 |
100 10 0 |
10 8 5 1 |
100 80 40 0 |
25 0 |
5000 1000 0 |
25 23.5 19 0 |
80 50 40 35 |
30 18 0 |
104 32 26 0 |
Layer |
20 0 |
2500 400 0 |
100 20 0 |
10 8 6 1 |
100 85 50 0 |
25 0 |
5000 1000 0 |
25 23.5 19 0 |
75 50 40 35 |
20 15 0 |
104 76 71 54 |
Broiler |
20 0 |
2500 400 0 |
20 0 |
10 8 5 1 |
100 75 50 0 |
25 0 |
5000 1000 0 |
25 23.5 19 0 |
80 50 40 35 |
35 20 10 |
104 79 74 54 |
Veal calves |
15 10 0 |
5000 2000 400 0 |
100 1 0 |
10 8 5 1 |
100 80 40 0 |
25 0 |
5000 1000 0 |
25 23.5 19 0 |
75 50 40 35 |
25 15 |
104 76 68 20 |
Rearing chicken |
20 0 |
2500 400 0 |
20 0 |
10 8 5 1 |
100 85 50 0 |
25 0 |
5000 1000 0 |
25 23.5 19 0 |
80 50 40 35 |
20 15 10 |
104 76 71 54 |
Sow lactating |
20 0 |
5000 3000 400 0 |
100 10 0 |
10 8 5 1 |
100 80 40 0 |
25 0 |
5000 1000 0 |
25 23.5 19 0 |
80 50 40 35 |
26 13 0 |
104 75 75 54 |
| Animal type |
Ammonia (ppm) |
Carbon dioxide (ppm) |
Hydrogen sulfide (ppm) |
Healthy Climate Index () |
Humidity (%) |
Light (%) |
Methane (ppm) |
Oxygen (%) |
Sound pressure (dB) |
Temperature (°C) |
Heat stress index (°C) |
Explanation:
- the upper black number is the Y axis top. When shown in the app, the graph would always be from 0 to (for example) 100, unless you zoom in. Without a Y axis top black number, the graph Y axis is shown from 0 to the red number.
- the lower black number is the Y axis bottom: outside temperatures below zero can only be shown when zoomed in with a click on the looking glass (in the data menu at app.healthyclimate.nl).
- the green number is created to show the healthy threshold when this cannot be 0. For example for CO2 and oxygen.
- ammonia has no green number, because we want it to be as low as possible. Some studies say from > 4 ppm ammonia there is already tissue damage in calves. But for humans the long term exposure max is 7 ppm.
- humidity has an upper and lower 'red zone'. There is no green score or green zone because the 'healthy' zone is in between the red numbers.
- the neutral zones between the black and red numbers are shown as white zones in our app, this is the good or healthy zone for this parameter.
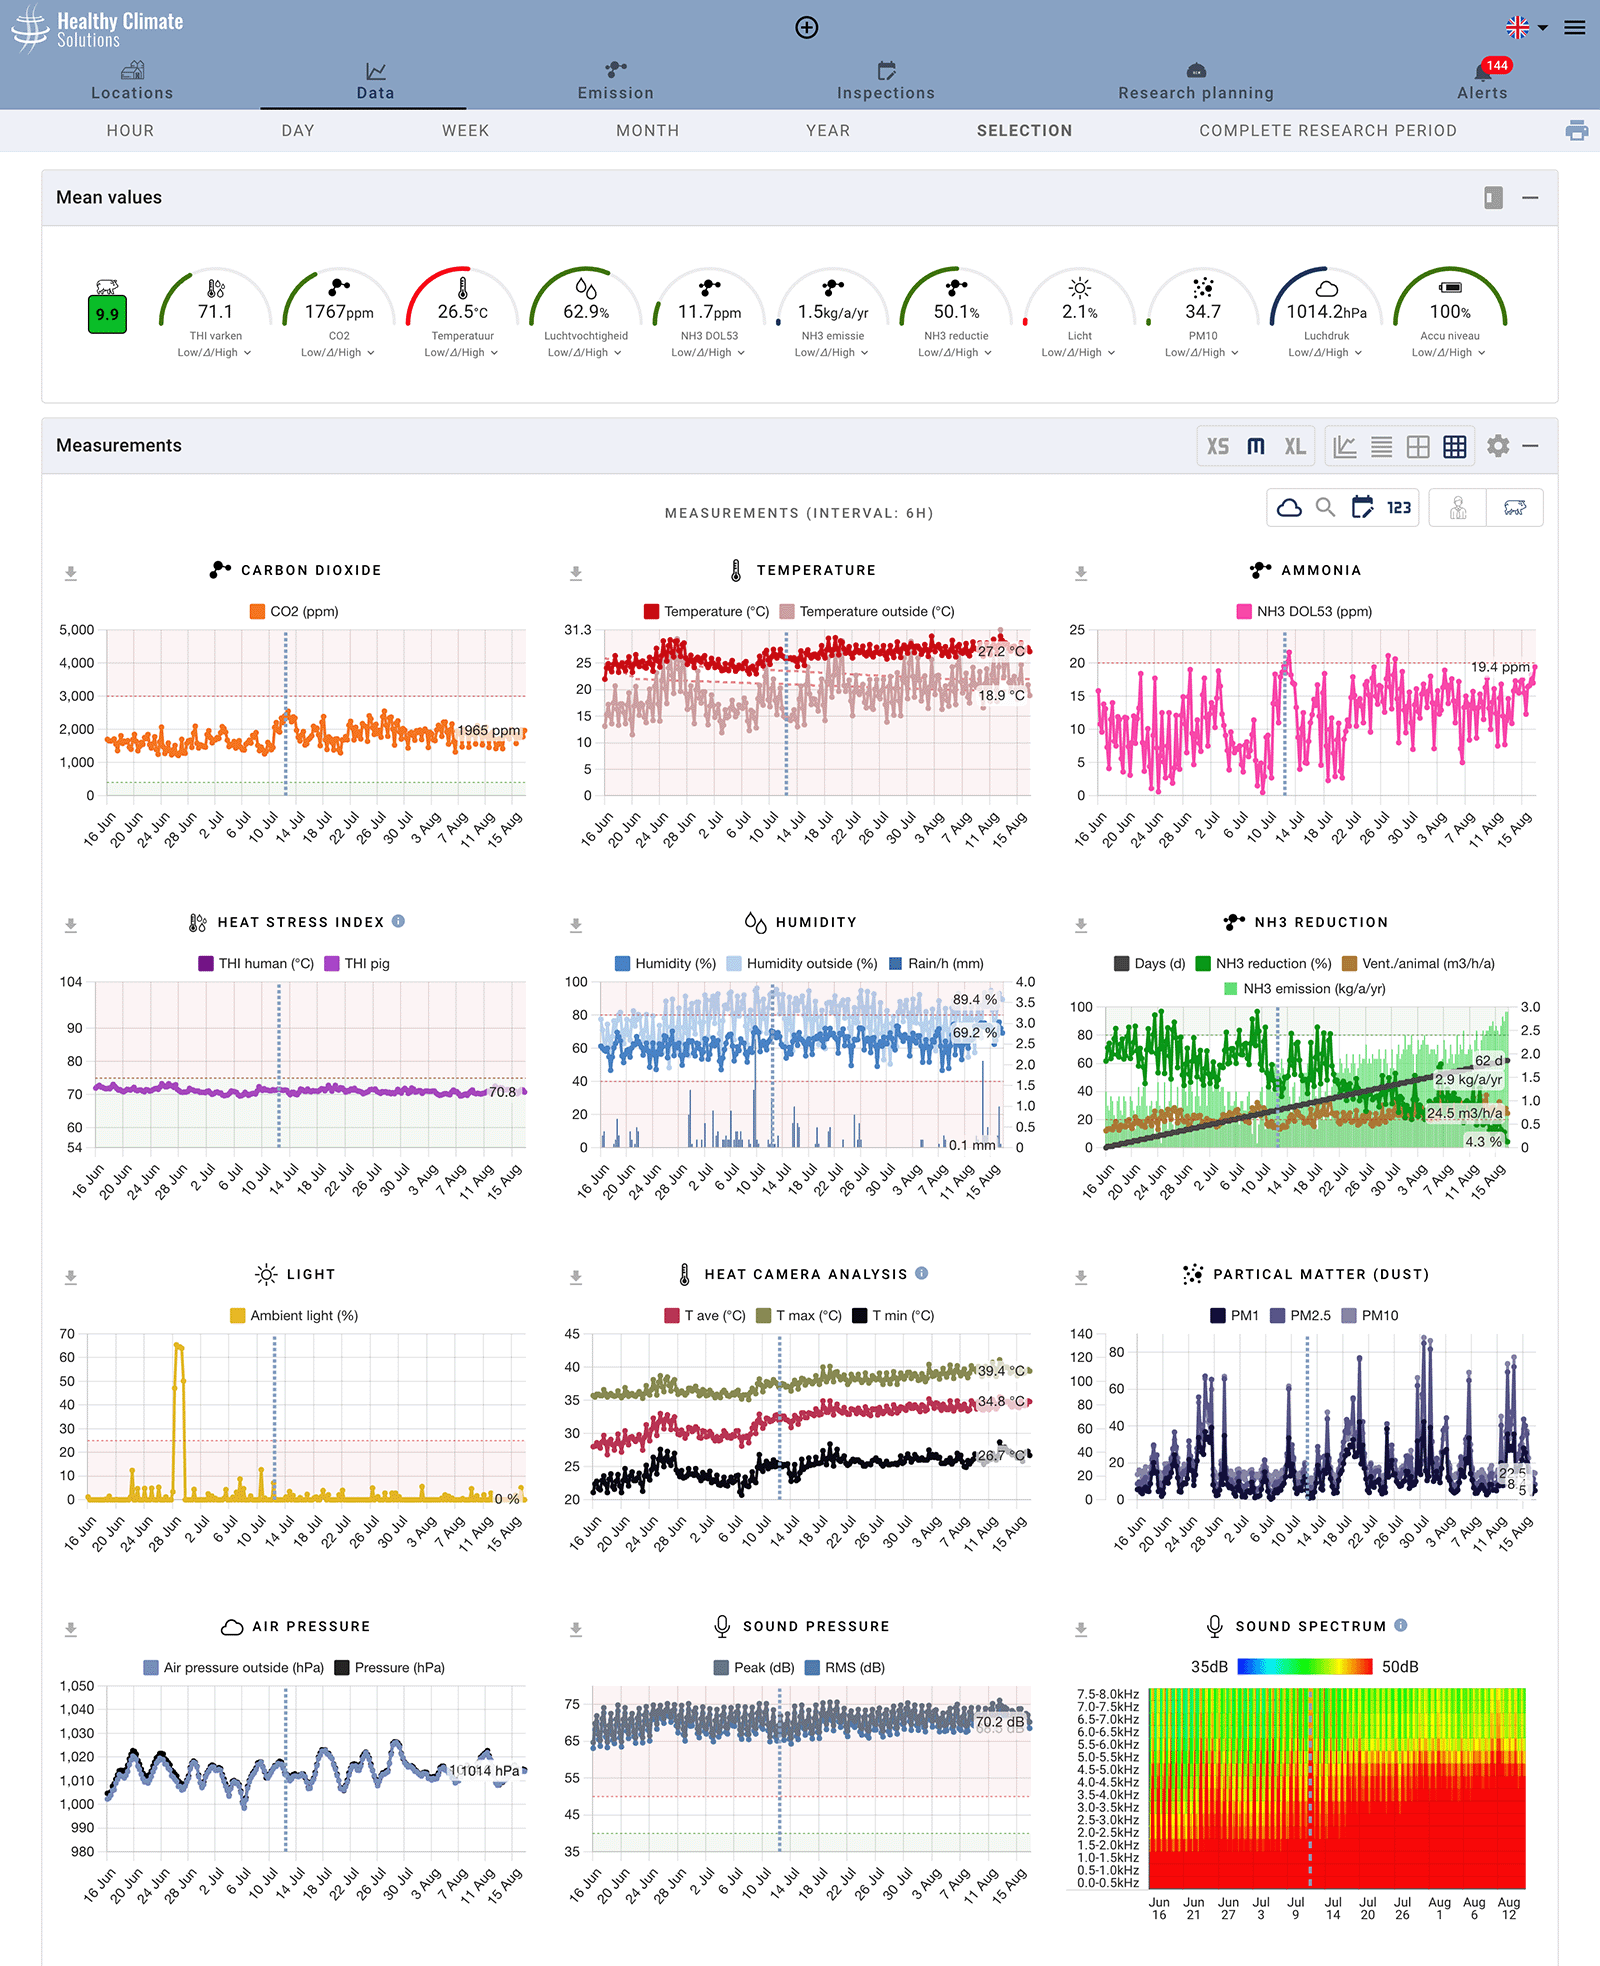
In the HCM app, the human climate threshold values are used in the graphs by default. If you define an animal type, the grade for this animal type will be calculated. Green horizontal lines represent the minimum value and red horizontal lines the maximum value for the selected animal type.
See the app screeshot below for an example of the boundary values for pigs.